The number everyone cites is wrong
HRSA — the federal agency that tracks healthcare workforce shortages — says the US needs 5,037 additional mental health providers. That number appears in policy briefs, grant applications, and news articles. It is technically accurate and functionally meaningless.
Here's why: HRSA designates a Mental Health Professional Shortage Area when provider ratios cross one of three thresholds — 1 core mental health professional per 6,000-9,000 people, or 1 psychiatrist per 20,000-30,000 people (codified in 42 CFR Part 5, Appendix C). Even the strictest of these thresholds is just the bar for "this area is so underserved it qualifies for federal intervention" — not a measure of whether people can actually get care. For context, HRSA's own target for adequate supply is 1 provider per 4,500 people, and the APA considers 1 psychiatrist per 10,000 the bare minimum. The 5,037 figure is simply the number of providers you'd need to add so that no geographic area crosses these designation bars. It has almost nothing to do with whether Americans can get a therapy appointment.
The real shortage is roughly 50 times larger.
The demand side
The most recent SAMHSA National Survey on Drug Use and Health (2024) puts the numbers plainly: 61.5 million American adults had a mental health condition in the past year — 23.4% of the adult population. 14.6 million had a serious condition, the kind that substantially limits daily functioning. 29.5 million adults with a diagnosable condition received zero treatment. Not inadequate treatment. None. Among those with serious conditions, 4.4 million — nearly 1 in 3 — went completely untreated.
Add adolescents and children: 5.3 million kids aged 12-17 had a diagnosed mental or behavioral health condition in 2023. Nearly 1 in 5 adolescents showed moderate or severe symptoms of generalized anxiety disorder. These are people with clinical diagnoses who need professional care and cannot get it.
The supply side
According to BLS 2024 data, the US has roughly 1 million clinicians who deliver mental health therapy — 483,500 counselors/LPCs, ~252,000 clinical social workers, 204,300 psychologists, 77,800 MFTs, and ~51,000 psychiatrists. That sounds like a lot — until you put it next to the demand. 61.5 million Americans have a mental health condition. 29.5 million of them received zero treatment last year. And yet HRSA's math says we only need 5,037 more providers to clear the shortage. That's one additional provider for every 5,850 untreated Americans.
The actual shortfall is approximately 250,000 additional full-time therapists just to serve those who currently go without any care at all.
HRSA's own longer-term projections, buried in workforce planning documents, are closer to the truth: by 2037, they project shortages of 88,000 mental health counselors, 136,000 psychologists, 31,000 psychiatrists, and 114,000 addiction counselors. Demand growth is outpacing supply growth at a ratio of roughly 4.5 to 1.
The pipeline is leaking
About 50,000 people earn mental health-related master's degrees each year across counseling, social work, and MFT programs. But only 46% make it through to licensure. That's roughly 23,000 new licensed clinicians entering the field annually.
Meanwhile, the workforce is hemorrhaging from the other end. 52% of therapists reported burnout in the past 12 months (SimplePractice, 2024). 93% of behavioral health professionals indicated they had experienced burnout (HRSA 2025). 40% of burned-out therapists are considering quitting the field entirely. 46% say they can no longer keep up with patient demand (APA). At current burnout rates, attrition risks outpacing new entrants — and the gap keeps widening. (Check your burnout score →)
Where the gap is worst
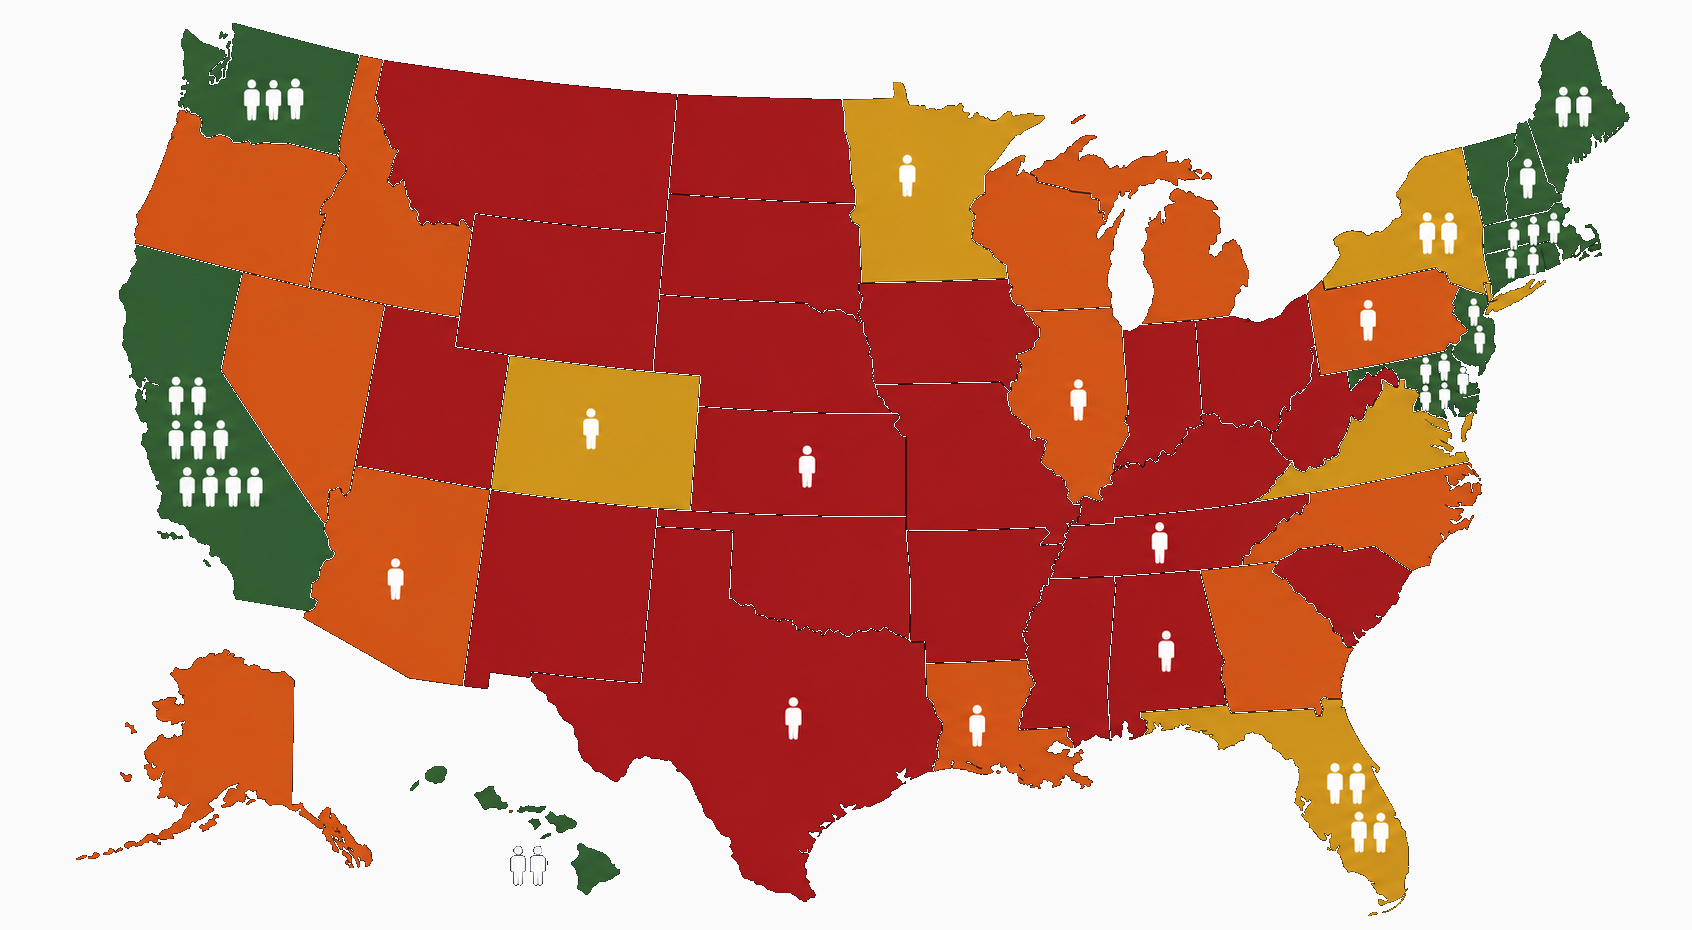
We combined HRSA shortage area data with SAMHSA prevalence data to create a composite gap score for each state — measuring treatment gap, provider ratios, and shortage severity together.
Hover/tap a state for details. Higher gap score = worse supply-demand mismatch.
Tennessee, New York, and Florida top the list — not because prevalence rates are highest there, but because the combination of high need, low provider availability, and large underserved populations creates the worst conditions for both patients seeking care and therapists managing impossible caseloads.
What this means on the ground
The average wait time for a new mental health appointment in the US is 94 days. The federal standard for Medicare Advantage is 7 business days. The recommended NCQA standard is 10 business days. Reality is 5 to 10 times longer than any standard that exists.
If you're a therapist practicing in a high gap-score state, you already know what 94 days looks like from the inside:
- Your waitlist is months long and the calls keep coming
- You're seeing 30+ clients a week because you can't turn people away
- The people who do get in are presenting with more severe symptoms because they waited three months while things got worse
- You're spending hours every night on SOAP notes, treatment plans, and insurance documentation instead of sleeping
And the math keeps getting worse. 137 million Americans — 40% of the population — live in a federally designated Mental Health Professional Shortage Area. That number grew from 122 million to 137 million in a single year.
Therapy Companion has zero insurance investors and zero payer ties. AI-powered session notes, treatment plans, and insurance compliance — built for therapists, owned by no one else.
The Texas picture
Texas ranks #12 worst nationally with a gap score of 66.7. The state has 386 designated shortage areas and needs 598 additional providers just to clear the HRSA designation bar — which, as we've established, is a floor so low it's practically underground.
Austin's rapid population growth has outpaced provider growth by a wide margin. For Austin-area therapists, the result is exactly the dynamic described above: impossible waitlists, unsustainable caseloads, and an administrative burden that compounds the clinical one.
What can be done
We cannot train 250,000 therapists in a year. The pipeline produces 23,000 licensed clinicians annually and loses nearly as many to burnout. The math does not close with hiring alone.
But here's where it gets interesting. Research shows the average therapist spends 35% of their working hours on documentation — SOAP notes, treatment plans, insurance paperwork, session summaries. On a 40-hour week, that's 14 hours of clinical time lost to admin work. At 800,000 clinicians, that's 11.2 million hours per week — roughly 580 million hours per year — spent typing instead of treating.
If you could give even half of that time back, you'd unlock the equivalent of 140,000 full-time therapists without training a single new one. That's over half the 250,000 shortfall — recovered, not recruited.
That is exactly what Therapy Companion does.
AI-generated session notes. After each session, Therapy Companion produces structured SOAP and DAP notes automatically — formatted, clinical, and ready for review. What used to take 20-30 minutes per client takes seconds.
Session prep that writes itself. Before each appointment, the platform surfaces the client's recent reflections, goal progress, mood trends, and clinical flags — everything a therapist needs to walk in prepared, without flipping through charts for 15 minutes.
Clinical insights across your caseload. AI-powered pattern detection identifies emerging themes, risk indicators, and treatment progress across all your clients. Flags that might take weeks to notice surface immediately.
Caseload management, billing, and supervision — all in one place. No more toggling between multiple systems to manage your practice. Notes, invoices, supervision hours, referral tracking — unified.
The math is simple: a therapist seeing 25 clients per week who saves 20 minutes on documentation and 10-15 minutes on session prep per client gets back 12-14 hours per week. Use half of that for 5-7 additional sessions — 5-7 more people off the waitlist, every single week, from one therapist. Use the other half to leave the office on time, take a real lunch, or just breathe between sessions — the kind of recovery time that keeps therapists from becoming the next burnout statistic. Scale that across a practice of 10 therapists and you're serving 50-70 more clients per week while your team actually wants to come back on Monday.
We're not going to train our way out of a 250,000-therapist shortage. But we can make the 800,000 therapists already in the field radically more effective — and keep them from burning out in the process.
Methodology
Supply data: HRSA Bureau of Health Workforce, Mental Health HPSA designation data (Q1 2026). Filtered to currently designated areas only (6,377 unique HPSAs from 39,594 total records). Deduplicated by HPSA ID. Population counts use geographic HPSAs only to avoid double-counting across designation types.
Demand data: SAMHSA 2024 National Survey on Drug Use and Health, State Estimates (2023-2024 annual averages). Adults 18+ prevalence rates for Any Mental Illness, Serious Mental Illness, Major Depressive Episode, and mental health treatment receipt. National totals from 2024 NSDUH Annual Report.
Workforce data: BLS Occupational Employment and Wage Statistics (2024). Pipeline data from CSWE Annual Survey (2023-2024), APA Practitioner Pulse Survey (2023), SimplePractice Burnout Report (2024), HRSA Behavioral Health Workforce Brief (2025).
Gap score: Composite percentile rank across treatment gap, average provider ratio, and total providers needed per state. Scale 0-100, where 100 indicates the worst supply-demand mismatch.
This analysis is part of our ongoing series using public health data to understand the challenges therapists face. Have a dataset you'd like us to analyze?